Be first to know
Keep up to date with ecommerce news, trends and articles. Brought to you by Stock2Shop.
Sign up todayIn an article written for UsabilityGeek.com entitled Why Web Site Usability Is Important For A Company, Justin Mifsud wrote that “a website operating in the very competitive ecommerce environment is more likely to lose a potential customer due to poor usability.” He goes on to point out that research indicates that “this can happen even if that site contains the information, product or service that that user is looking for.”
Your data is the nuts and bolts of your online store. Unless your products are correctly represented and segmented into categories that make navigating your website easy, you will lose business. Fast.
There are six steps involved in putting the information from your accounting system into a format that is suitable for selling online effectively. We’re going to lead you through each step so that you know how to build a well-categorised list of product data.
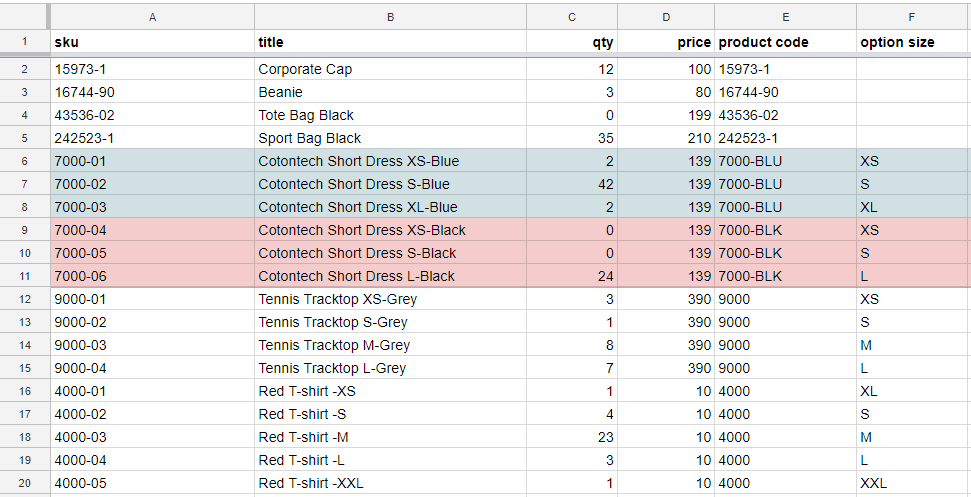
Your raw product data will usually be stored in your ERP or accounting system, and will typically include an SKU (‘Stock Keeping Unit’, also referred to as an item code), title, quantity and price.
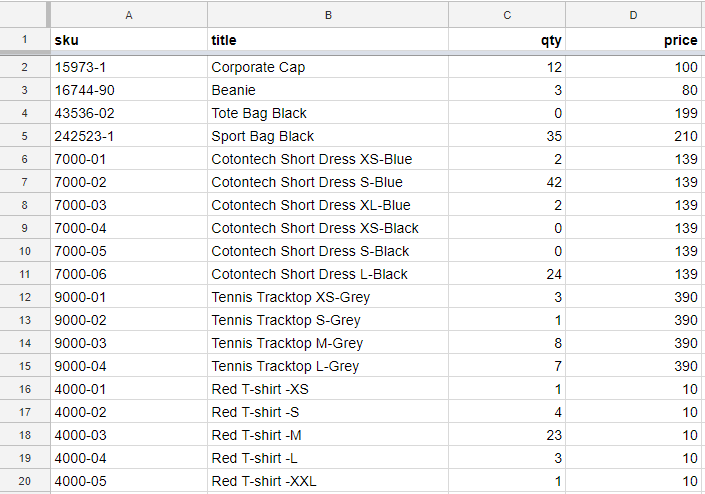
The above screenshot is an example of product data from a fictitious company (let’s call it Apparel Limited) that sells caps, beanies, bags, dresses, t-shirts and tracktops. Of the 19 unique SKUs on this sheet, you will notice that some of the items look similar. This is often (but not always) an indication that these SKUs should be grouped together as variants of one product. In rows 16 to 20, for example, the SKUs are size variants of the product “Red T-shirt”.
It’s essential to understand the difference between products and variants. A product is comprised of one or more variant, and includes information such as title, collection, description, brand and product type. Each variant has its own SKU code, price and quantity.
In order to group SKUs together as a product with multiple variants, we must add some fields to the Apparel Limited spreadsheet
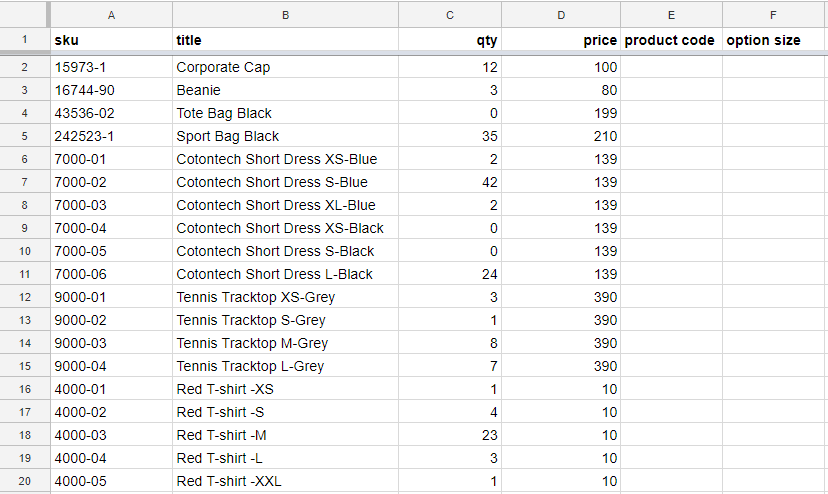
See columns E and F above:
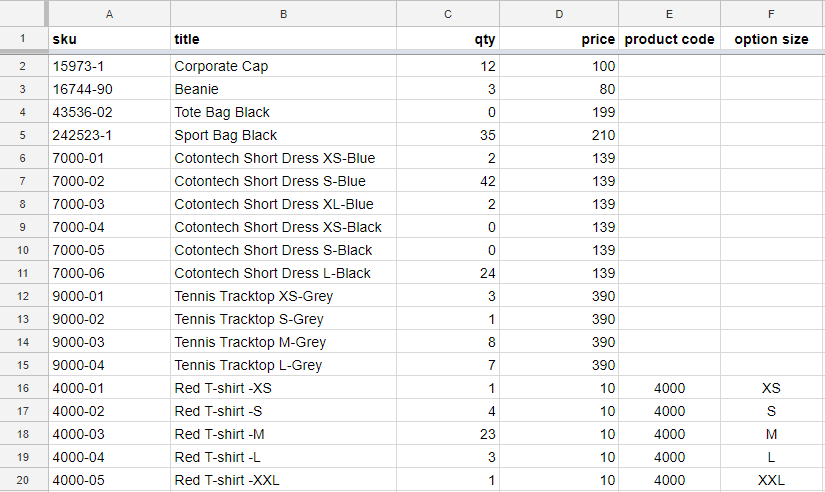
Continuing with the “Red T-shirt” example, you can see in the below sheet that we’ve given each of these SKUs the same product code in column E. We then put the differentiating characteristic of each variant (size) into column F.
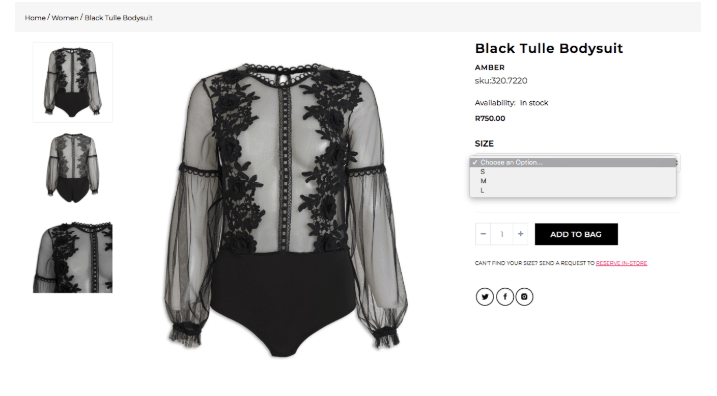
Below is an example of how a product with a “size” option might look on an ecommerce website (see the dropdown).
We suggest that only SKUs that look the same be grouped together as variants. A good rule of thumb is: if two SKUs require different images, they should be separate products. This means we recommend that you don’t use colour as an option when grouping variants together.
On the Apparel Limited data sheet below you can see that the “Cotontech Short Dress” comes in two different colours (blue and black), as well as different sizes. Our recommendation would be to show the “Blue Cotontech Short Dress” and the “Black Cotontech Short Dress” as separate products (with different product codes), each with size as its variants.
The golden rule of variants is that: No two variants of a product can have exactly the same option values.
In other words, our Blue Cotontech Short Dress (product code “7000-BLU”) cannot have two variants with the same size. If for example, there were two variants marked XL, how would your customer know which one to choose?
Note: Some products do not have multiple variants (see lines 2 to 5 above). In these instances, you can simply copy the SKUs into the “product code” fields and leave the option fields empty.
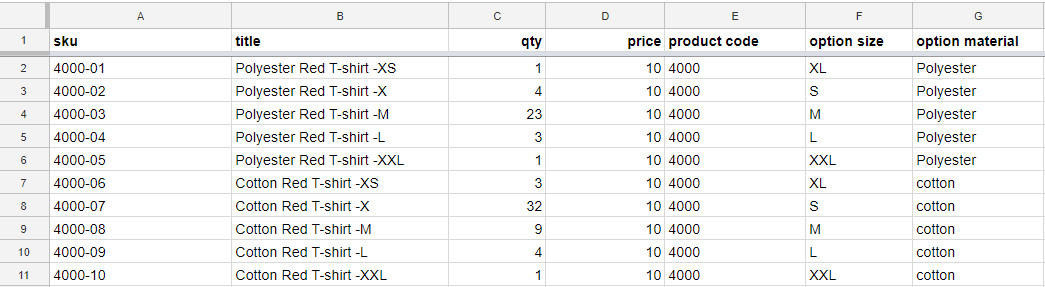
A product can have multiple options. For example, if we decided that we wanted to sell our Red T-shirt in different materials as well as different sizes, you could have both of these product options on your data sheet.

This means that the Red T-shirt would have two dropdown options on our website: “size” and “material”. Remember to consider the user experience when setting up your options. Too many dropdowns on your site can make it look messy, or worse, confuse your customers. Less is more.
Options can be product characteristics such as size, material, width, weight or even colour. You can make your options anything, but the golden rule still applies: a product with two variants that have identical options is a no no.
Below is an example of a product (the red T-shirt) with “size” and “material” options captured correctly. No two variants have the same combination of size and material.
In contrast, below is an example of the same product with the options captured incorrectly. The problem is that the two highlighted variants have the same size and material combination.
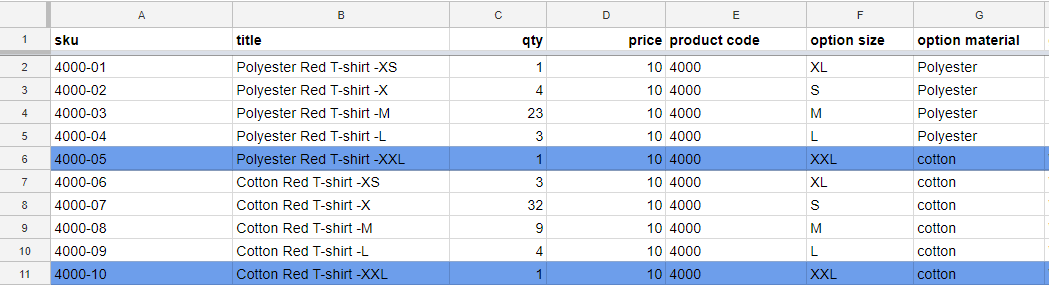
If you have duplicate options within a product, that means that one of the following problems has occurred:
Pivot tables are a great tool to ensure you haven’t assigned two or more variants to a product with the same option. A pivot table report quickly summarises your data by grouping rows and columns together on a separate sheet.
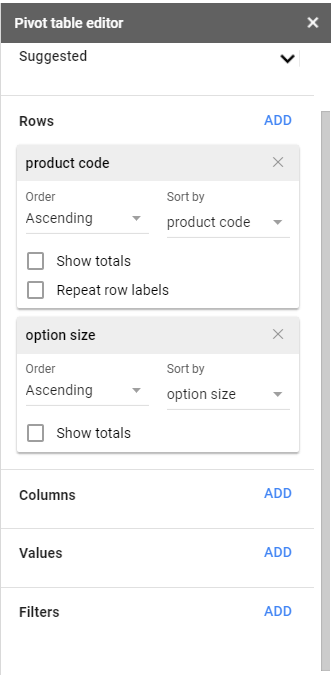
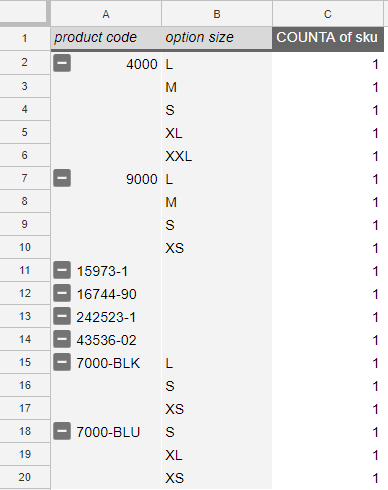
If you see a COUNTA that is more than 1 in your pivot table, it means you have more that one SKU with the same product code and product option (“size” in this example). This is an error.
Use the filter function on your COUNTA column to show only product codes with a value other than 1, then find the offending products in your main data sheet to fix the issues. You might find that they should in fact be separate products, or you may have captured your options incorrectly.
Once you’ve identified the errors and rectified them, go back to your pivot table to double check that there are no COUNTA values greater than 1.
In order to add value and enrich your data, you need to describe your product in a meaningful way. This will help your customers understand what you are selling and find the products they are looking for.
We often see customers defining the navigation for each product on their spreadsheet by adding in category, sub category and sub sub category columns. A better approach is to describe the products’ attributes in a meaningful way. These attributes can then simply be assigned to your navigation, and can be easily rearranged at later stage without having to recapture the underlying data.
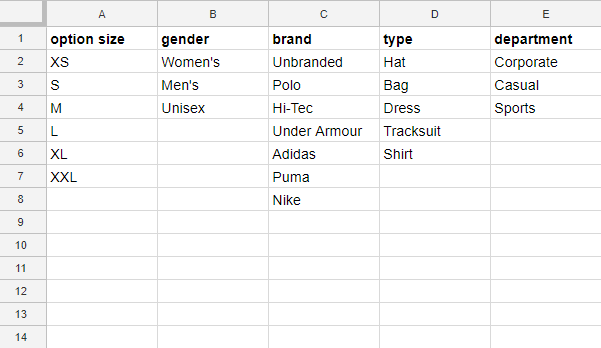
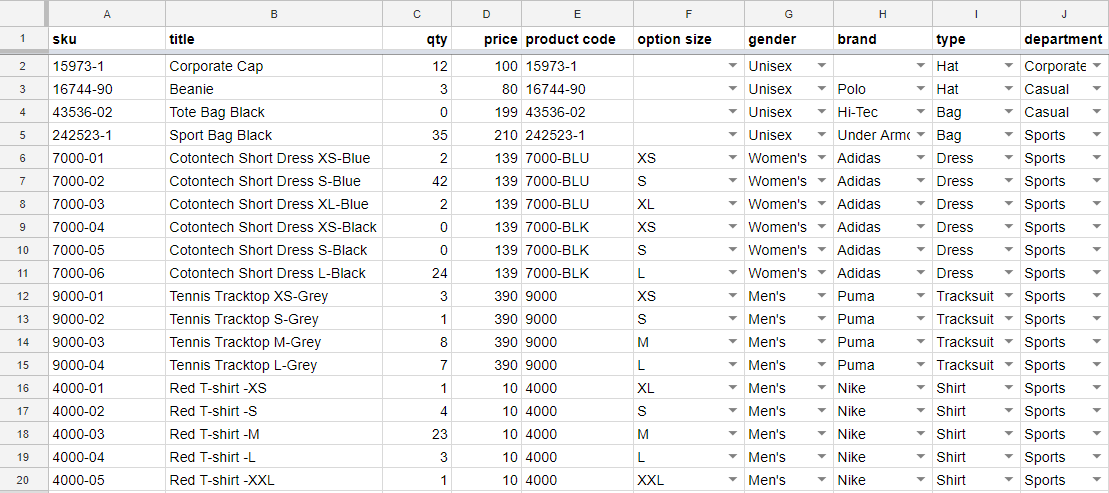
In the below example you can see that we have created attributes named gender, brand, type and dept. Customers can now apply filters such as sports, men’s and shirts, for example, to narrow their search. For a more comprehensive article on the power of layered navigation, click here.
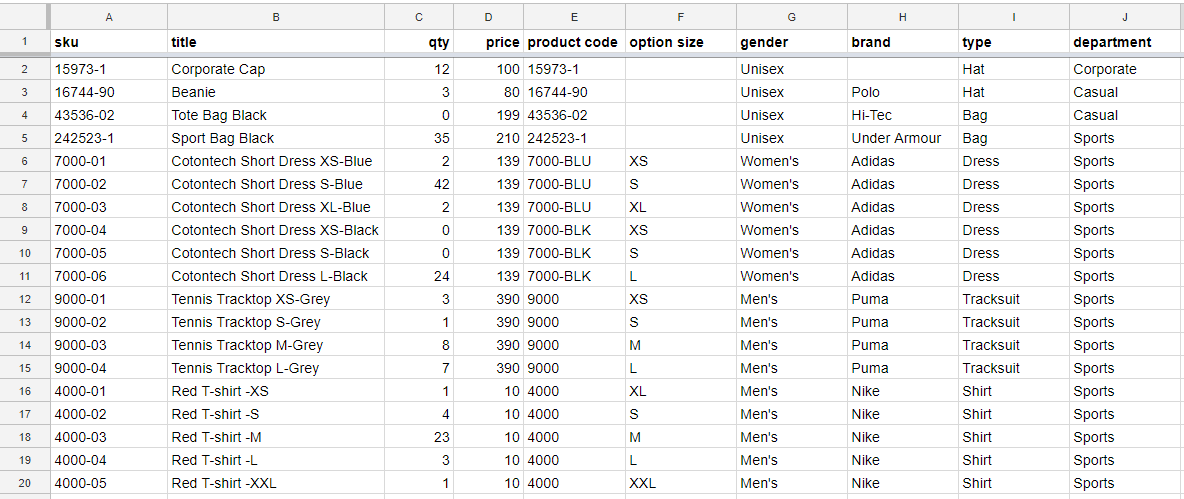
Note: When adding these attribute columns it is important to remember that you’re enriching a product, not a variant. You will notice in the above example that all the SKUs with the same product code have identical values in each attribute field.
Effectively defining your attributes makes your products easier to find on your website. When going through this process, consider all the ways a customer might search for a particular product.
Layered navigation is a simple and effect way to find what you’re looking for by adding multiple filters until you’ve narrowed your search. For example, on the Apparel Limited website I could select the “Men’s” filter which would leave me with just the Tennis Tracktop and the Red T-shirt (as per the below sheet). If I then added the “Puma” filter, I’d be left with just the Tracktop.
Some systems do not accommodate layered navigation. In such cases you might want use your attributes to create a hierarchy of categories and subcategories to help customers narrow their search.
As long as you capture the necessary details on your spreadsheet, you have the flexibility to choose the structure you want, and the ability to adjust it later.
Note: There may be blanks in some columns because not all attributes apply to all products (for example, brand).
Using a pivot table is an great tool to help you explore ways you can build navigation and categories on your website.
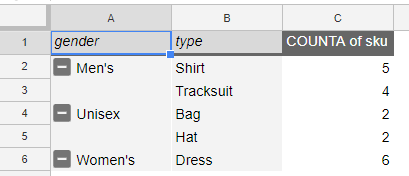
Now that we have captured all the attributes on our product data sheet, we can summarise how our products are distributed between the attributes to see how the navigation/categories would work
When deciding on your navigation structure, it’s helpful to know how many products are in each category.
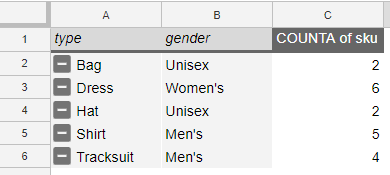
Note: In the above example, you could also offer the customer the opportunity to filter first by type and then by gender (see below). You can adjust the order of your attributes in your pivot table to see how these different user journeys might look.
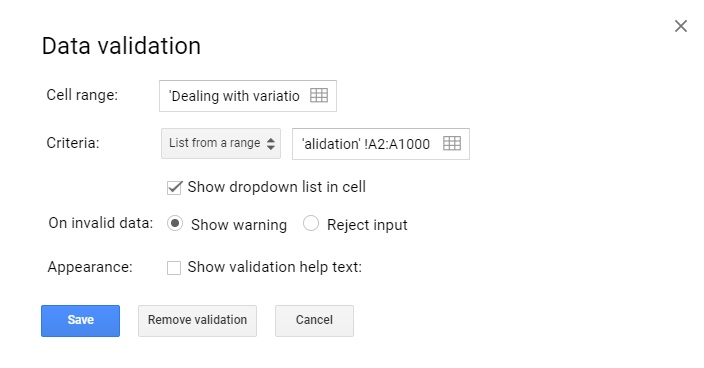
When setting up your options and attributes, it’s important that your naming conventions are consistent. For example, you must decide if you’re going to use “S / M / L” or “Small / Medium / Large, and apply that convention throughout your size options. The same applies to your attributes.
The best way to ensure consistency and avoid spelling errors is to use data validation. Here’s a step-by-step guide how to do this in Google Sheets (other software may work slightly differently, but the principle is the same):
You can build a beautiful website with all the bells and whistles, but the only way to turn visitors into customers is to make it easy to navigate. The secret to an intuitive, user-friendly lies in well-considered data. Once that is in place, user satisfaction will rise and so will your sales.
Now that you have carefully segmented your product information and ensured that it is accurate, Stock2Shop can help you manage the flow of data to and from your website. And should you decide to sell on multiple channels, it provides a centralised console from which to manage all your products in one place.

Keep up to date with ecommerce news, trends and articles. Brought to you by Stock2Shop.
Sign up todayUnderstanding product data is essential for a successful ecommerce business. Here’s an overview of the most important elements of product data you need to understand.
Read MoreCategorising products correctly is a major pain point for many ecommerce websites. Layered navigation is the solution: find out how – and why – to implement it
Read MoreWant to find out exactly how Stock2Shop can make your business more efficient and streamlined?
Contact Us